Focus sectors for enhancing Indian exports to Australia
Trade of goods
Overview of Australian imports from the world
The total value of goods imported by Australia stood at USD 235.5 billion in 2018. The key commodities imported by Australia are petroleum and mineral oils, passenger vehicles, ships, boats, and floating structures, commercial vehicles, pharmaceutical products, gems and jewelry, mobile phones, communication apparatus, computers, pneumatic tyres etc...
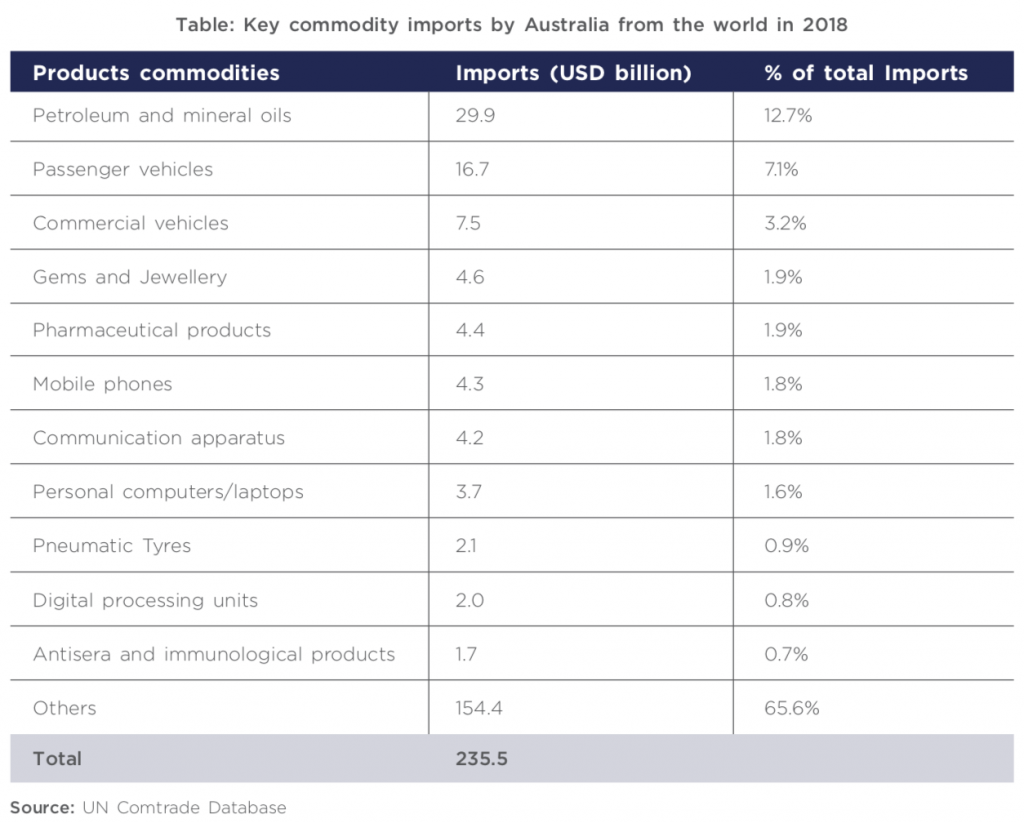
Australia imports majority of its crude petroleum and refined oil from refineries in South Korea, Japan and Singapore to fulfill its domestic consumption needs. The closure of many oil refineries in Australia, due to their high operating cost, has resulted in the decline of local production of refined petroleum from 750,000 barrels per day in 2001 to ~400,000 barrels in 2018-19. At the same time, the import of refined products has increased from ~100,000 barrels per day in 2000-01 to ~600,000 barrels per day in 2018-19. Currently, 51-53% of Australia’s imported refined petrol comes from Singapore’s refineries, 18% from South Korea and 12% from Japan. Asian refineries are extremely competitive in terms of production and transport costs. At the current import rate, Australia’s refineries may become 100% reliant on imported petroleum by 2030.
The automotive industry, which was once a cornerstone of Australia’s economy, has declined over the years. Majority of the car manufacturing companies, viz., Mitsubishi, Ford, Toyota and Holden (General Motors Subsidiary) have shut down their plants due to high production costs. However, they will operate as pure importers and wholesalers. A continued decrease in import duty to 5% in 2008, signing of multiple FTAs (primarily with USA and Thailand), high labor wages, low economies of scale and the global financial crisis have led to a decline of the automotive sector. The Automotive Production continuously declined to reach sub 300,000 vehicles in 2009 and a mere 98,632 vehicles in 201779. The last car manufacturing facility (General Motors owned Holden) in Australia was shut in 2017.
Despite the closure of domestic production units, vehicle sales in Australia have been growing at 2.5% CAGR over the past two decades. The sales hit a record high in 2017 with 1,189,116 units sold, resulting in increased imports of passenger and commercial vehicles. Demand for sports utility vehicles (SUVs) and pick-up trucks has been increasing. In the passenger vehicles category, Australia mainly imports medium sized cars from Japan, South Korea, Germany and Thailand. A dominant trend in the passenger vehicles market is the decline of the large car segment with customers shifting to either the smaller, fuel-efficient vehicles or SUVs / pick-ups. The Australian passenger vehicle market is dominated by Japanese and Korean brands, with Toyota being the market leader followed by Mazda, Hyundai, Mitsubishi, Ford and Holden.
The growth in the Australian motor vehicle market has been driven by a strong demand for SUVs. SUV sales have grown at an extremely healthy rate of 10% CAGR over the last two decades, recording sales of 495,300 units in 2018. In the LCV market too, Toyota is the market leader followed by Mazda and Hyundai.
Commercial vehicles (including pick-up trucks) recorded a sale of 237,972 units in 2018. Australia mainly imports delivery trucks with Gross Vehicle Weight (GVW) < 5 tonnes from Thailand and Japan. After witnessing subdued sales between 2005 and 2015, sales have witnessed a revival with new investments in the mining sector and recovery in commodity prices. Toyota is the market leader in the pick-up market with its Hilux being the best-selling pick-up truck. Australia’s heavy truck market is highly competitive with 16 brands accounting for sales of approximately 10,000 units sold annually. However, the three Japanese companies, i.e. Isuzu, Hino and Fuso, account for close to half of the market80.
In the gems and jewellery category, Australia mainly imports unwrought gold from Papua New Guinea, Japan and New Zealand. However, gold is also re-exported to other countries. In the communication apparatus category, Australia imports transmission-reception apparatus for TV, radio, etc. from China, Vietnam, USA and Malaysia. In the computers category, Australia imports computer data storage units and digital CPUs from China, USA, Singapore, Malaysia and Vietnam81.
Overview of India’s goods exports to the world
Trends in Indian exports
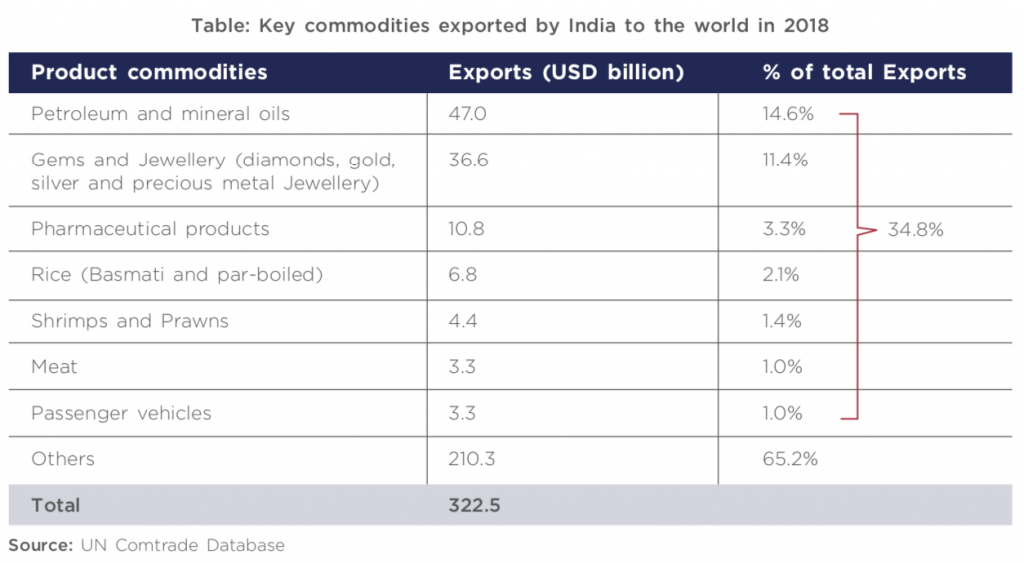
As of 2018, the value of India’s goods exports to the world stood at USD 322.5 billion. India’s goods exports witnessed a degrowth of ~8% during 2013-2016 due to a sharp fall in oil prices, fall in global trade, weak global demand and high concentration of India’s exports in a few commodities. Petroleum products, which account for a high share of ~15% in India’s overall goods exports declined by ~26% during 2013-2016 due to slowdown in global demand and a fall in the global oil prices. Gems & jewellery exports, which constitute 11% share of the overall exports-also witnessed a decline of 2% during 2013-2016. However, India’s exports revived in 2017 and continued to grow in 2018. Exports witnessed a growth of 11% during 2018 backed by growth in petroleum products, gems & jewellery and engineering goods.
Key commodities exported by India to the world
The top ten commodities exported by India include petroleum products, gems & jewellery, pharmaceutical products, rice, prawns & shrimps, meat and passenger vehicles. The export of the top ten commodities amounted to ~USD 112 billion and accounted for ~35% of India’s total exports in 2018.
Trade relationship with Australia
The bilateral trade of goods between India and Australia has strengthened over the years, growing at CAGR of ~9% from USD 12.5 billion in 2014 to USD 17.8 billion in 2018. India’s goods exports to Australia grew at a CAGR of 10% from ~USD 2.6 billion in 2014 to ~USD 3.7 billion in 2018.
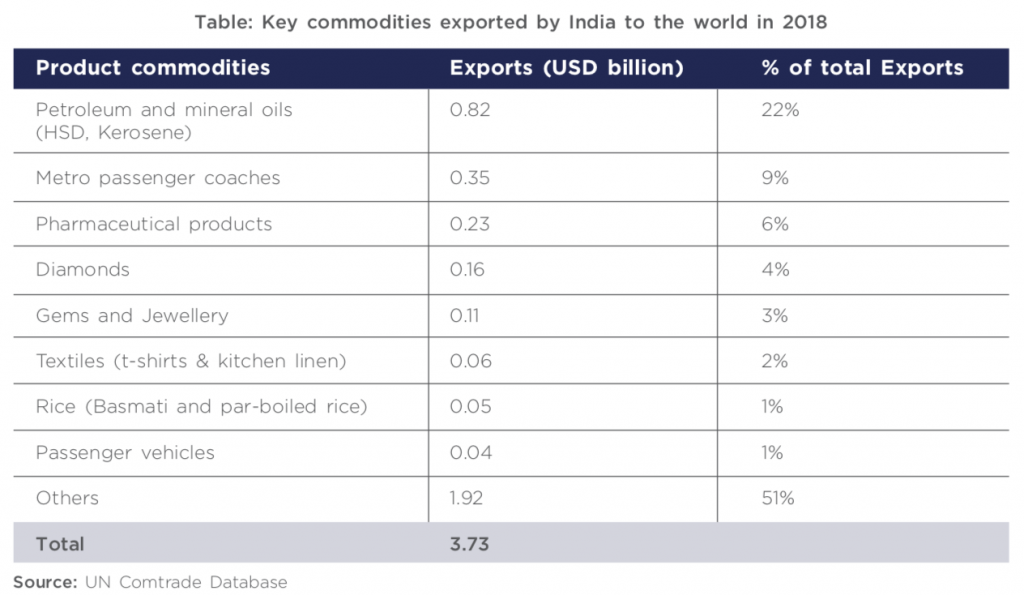
The key commodities exported from India to Australia include petroleum and mineral oils, pharmaceutical products, diamonds, gems & jewellery, metro passenger coaches, cotton textiles, rice and passenger vehicles. These commodities account for ~50% of India’s goods exports to Australia.
Petroleum and mineral oils
The growth in India’s goods exports to Australia has been primarily driven by a rise in exports of petroleum & mineral oils (kerosene, high speed diesel, aviation fuel), which have grown at 23% CAGR- from ~USD 360 million in 2014 to ~USD 820 million in 201882.
India’s exports of petroleum products to the world stood at USD 47.0 billion in 2018. Although India is among the top five importers of crude oil in the world, it is also a major exporter of refined oil and other petroleum products such as high-speed diesel, aviation turbine fuel, light diesel oil, etc. Oil refining is one of the core industries in India, marked by the presence of “Maharatna” PSUs like ONGC, IOCL, BPCL and “Navratna” PSUs like HPCL, OIL and large private companies like Reliance Industries and Essar Oil. India has 19 public sector refineries and 3 private sector refineries, which have a total capacity of ~215 million metric tonnes/ annum83. The Jamnagar refinery in India is the world’s largest refinery with a capacity of 33 million metric tonnes/annum. India also takes advantage of its strategic location between crude oil exporting Middle-East nations and other Asian consumers to export refined oil and other petroleum products.
India contributes approximately 7% towards Australia’s total imports of petroleum and mineral oils (excluding crude) of USD 19 billion84. India can leverage its strengths in this sector to increase its share in Australia’s petroleum and mineral oils imports (excluding crude).
Gems and Jewellery
India is the fourth largest exporter of key gems-rubies, sapphires, emeralds, diamonds-, imitation jewellery and pearls to Australia. India has developed the art of diamond cutting, gems polishing and jewellery designing through its rich history and cultural heritage. Gems and jewellery exported from India are internationally acclaimed for their designs and cuts. India is the world’s largest cutting and polishing center for diamonds. The diamonds are imported, processed in India and re-exported. Gems & jewellery constitute a major portion of the India’s goods exports to the world and exports were valued at USD 36.6 billion in 2018. Availability of high skilled labor, low costs, favorable policy environment and strong overseas demand for Indian jewellery from USA, UAE, China, Hong Kong, etc. are the key reasons for India’s strong performance in gems and jewellery exports. Australia’s total gems and jewellery imports stood at USD 6.6 billion in 2018 of which India’s gems and jewellery exports were valued at USD 0.35 billion, representing a 5% share. India could target to increase its gems and jewellery exports to Australia by leveraging its strengths in this sector85.
Pharmaceutical products
India’s total exports of pharmaceutical products to Australia were valued at USD 0.29 bn, accounting for a low share of 4% in Australia’s total pharmaceutical products imports of USD 8.17 bn in 201886. Indian players predominantly operate in the generic drug segment. India is the largest supplier of generic medicines in the world, accounting for 20% of the global generic medicines supply by volume87. India’s exports of pharmaceutical products to the world were valued at ~USD 10.8 billion in 2018. Availability of low-cost skilled labor and a diversified industry, which includes small and medium sized producers, have made India a hub for generic drug manufacturing. India is also emerging as a hub for manufacturing of biosimilars with leading companies such as Biocon, Glenmark pharmaceuticals and Zydus Wellness actively focusing on biosimilars88 89. India’s biosimilars exports to the world stood at ~USD 51 million in 2017 and have a high potential for growth in the future90. With its strong capabilities in generics and biosimilars, India could significantly increase exports of these products to Australia.
Rice and other agriculture commodities
India is the second largest exporter of rice to Australia after Thailand. While India’s total exports of all rice varieties to Australia were valued at ~USD 0.054 billion, the exports of par boiled rice and basmati rice stood at ~USD 0.053 billion in 2019 (~98% share)91. India’s share in Australia’s imports of other varieties of rice-broken rice, brown rice, etc. is low and stands at ~5%92. India is the second largest producer of rice in the world. Basmati rice and par-boiled rice are the major varieties exported from India. India’s rice exports to the world stood at USD 6.8 billion in 2018. India’s basmati rice has a high demand from Middle-Eastern countries, the UK and US. India can leverage its brand power and expertise in rice production to become the top exporter of basmati and par-boiled rice to Australia and also increase the exports of other varieties of rice.
Apart from rice, India could also tap into the opportunity to increase its exports of other agricultural commodities. India is the largest producer of fruits - mangoes, bananas and papaya and vegetables - potatoes, onions and cauliflowers93. However, India constitutes a low share of ~0.3% in total fruits imports and ~3% in total vegetable imports of Australia94. India is also a notable exporter of meat and seafood to the world, with its total meat and sea food exports being valued at ~USD 10 billion in 2018. However, India’s share of meat and sea food imports by Australia is <0.2%. India could leverage its strengths in each of these agricultural commodities and increase its exports.
Rail equipment
In 2016, India exported metro-passenger coaches to Australia for the first time. The coaches were exported by Bombardier and Alstom who won contracts to set up metro projects in Melbourne and Sydney, respectively. Bombardier has invested about ¤33 million in its Indian manufacturing facility in Baroda and has orders to export 450 metro rail coaches to Australia in a two- and- a- half year period. Alstom will supply railway coaches for the Sydney project from its manufacturing units in South India. The companies have set up the manufacturing facilities in India to take advantage of the large pool of engineers and low labor cost. India currently constitutes ~29% share of the rail equipment imported by Australia and can target further increase in its railway equipment exports to Australia95.

Passenger vehicles
India primarily exports cars with internal combustion engines of capacity 1,000-1,500 cc to Australia. A few top models exported from India include Ford Ecosport, Suzuki Baleno and Suzuki Brezza. India is a large automotive manufacturing hub due to availability of low cost labour and high domestic demand. India’s passenger vehicles exports to the world were valued at USD 3.3 billion in 2018. India is Asia’s third largest passenger vehicle market in the world with ~3.1 million96 car registrations in 2018 and is dominated by large organized players such as Maruti Suzuki, Hyundai, Mahindra & Mahindra, Honda, Ford and Toyota. India’s passenger vehicle exports to Australia currently account for only 0.4% of Australia’s total passenger vehicle imports97. Indian companies can explore the opportunity of exporting pick-up trucks, which are witnessing high growth in Australia, and also target increase in the exports of SUVs for the Australian market.
In addition to passenger vehicles, India could also tap into the opportunity of increasing exports of automotive parts and spares (including automotive tyres) to Australia. Pneumatic tyres are a part of the top ten imported commodities of Australia. Australia’s total imports of automotive parts stood at USD 3.3 billion in 2018. Although India’s exports of automotive parts to the world stood at USD 5.7 billion in 201898, it has a low share of 0.7% in Australia’s imports of automotive parts. India can leverage its ability to manufacture low cost automotive spare parts of international quality which meet Australian specifications to supply these products to Australia. Indian automotive spare and components manufacturers should work with Australian importers/ distributors to get themselves registered as a source of long- term supply.
Textiles: T-shirts and Kitchen linen
Australia’s total imports of t-shirts and kitchen linen from the world stood at USD 491 million in 2018. India was one of the leading exporters (3rd largest for t-shirts and 2nd largest for kitchen linen) of these products to Australia due to its ability to manufacture knitted jerseys, t-shirts, pullovers at low cost99. Australia also imports other textiles articles such as blankets, sacks, bedlinen, variety of apparel, etc., which are produced in India. India can therefore explore the opportunity to increase its current textile exports as well as other textile articles to Australia.
Renewable energy equipment
Australia is increasingly focusing on generation of electricity through renewable resources such as solar power and wind power. India has a low share of 0.2% in Australia’s total imports of solar modules/cells (USD 1.6 billion in 2018) and 0.03% share in Australia’s total imports of wind turbines (USD 13.37 million in 2018)100. India has significant potential to export solar panels and wind energy equipment. Indian companies such as Tata Solar Power, BHEL, Indosolar manufacture solar cells while Suzlon, Gamesa, Vestas, General Electric India manufacture wind energy equipment. India can therefore explore the opportunity to increase its solar and wind power equipment exports to Australia.
Key opportunities for India
- Indian exports account for a low share of 1.6% of Australia’s total goods imports. India can leverage its strengths in key commodities such as refined petroleum products, pharmaceuticals and biosimilars, gems and jewellery, passenger and commercial vehicles and spares, agricultural commodities like rice and fruits, renewable energy and railway equipment to target a higher wallet share in Australia’s goods imports.
- Australia’s total imports of the key commodities exported by India from the world stood at USD 27 billion in 2018. Despite being a major exporter, India had a low share of 5% in Australia’s imports of these commodities. The low wallet share, despite India’s stronghold on the exports of these products, points towards a large opportunity gap that India can address.
- India has the potential to increase its goods exports to Australia from USD 3.7 billion in 2018 to USD 10 billion in 2025 to USD 20 billion in 2035.
79 International Organization of Motor Vehicle Manufacturers
80 Automotive Report Australia, November 2018, Economist Intelligence Unit
81 The Observatory of Economic Complexity (OEC)
82 UN Comtrade Database
83 Ministry of Petroleum and Natural Gas
84 HS code 2710; Trade Map
85 HS code 71; Trade Map
86 HS code “30”; Trade Map
87 Pharma exports up by 3 pc, The Economic times
88 Understanding the biosimilars opportunity for Indian Pharma, The Economic times
89 Surge of Indian Biosimilars Market Forecast In 2019, CPhI
90 Biosimilars market in India; Current status and future perspectives, NCBI
91 HS code 1006; TradeMap
92 HS codes 100610, 100620, 100640; Trade Map
93 HS codes 08 for fruits and 07 for vegetables; Trade Map
94 India is world’s largest producer of Mangoes, Banana; Financial express
95 HS code 86; Trade Map
96 Economist Intelligence Unit
97 HS code 87; Trade Map
98 HS codes 8708, 401110, 401120, 401211, 401212; TradeMap
99 HS codes 610910, 630260; Trade Map
100 HS codes 8541, 841280030; Trade Map
Next topic: