Macroeconomic overview
Demographic overview

English is the most common language spoken in Australia, followed by Mandarin, Arabic, Cantonese and Vietnamese. While Australia does not have an official language, English is the de facto national language. Australian English is spoken with a distinctive accent and lexicon and differs slightly from other varieties of English in grammar and spelling.16
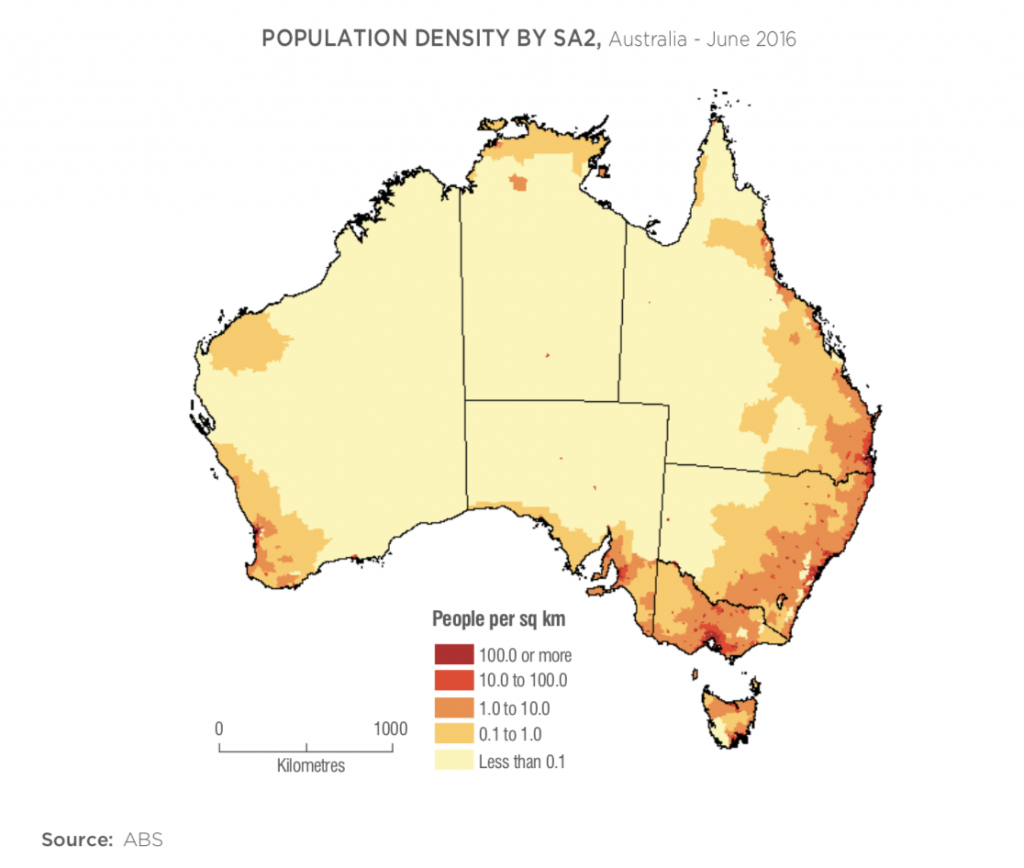
Australia has a population of approximately 24 million. Approximately 85%17 of the population resides in urban areas and around 70% of this population resides in the coastal cities of Sydney, Melbourne, Brisbane, Perth and Adelaide. Most of the central and western parts of the country comprise of desert areas that are sparsely populated.
Population density varies greatly across the country. Australia’s population density as of June 2016 was 3.1 people per square kilometer (sq. km). Among the states and territories, the Australian Capital Territory had the highest population density, at 171 people per sq. km, followed by Victoria (27), New South Wales (9.7) and Tasmania (7.6). The remaining states and territories all had population densities below the national average, with the Northern Territory having the lowest at just 0.2 people per sq. km.18
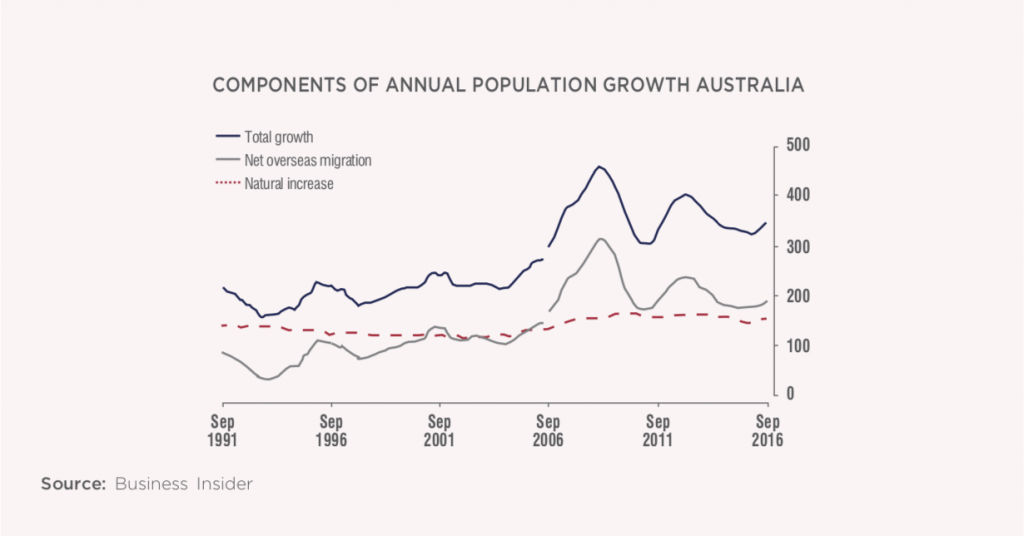
Melbourne is Australia’s fastest-growing city along with Sydney and Brisbane. The city accounted for more than 70 % of the country’s population growth in financial year 2016-17.19 Overseas migration has been a significant reason for population growth in the three aforementioned cities. The 2016 census of Australia also revealed a similar trend. Nearly half the population was born overseas or had at least one overseas-born parent. As per the 2016 Census, the most common countries of birth of the population in Australia were the UK (17.7%), New Zealand (8.4%), China (8.3%) and India (7.4%).20

Australia’s per capita GDP is one of the highest in the world, at approximately USD 55,420 in 2019 (at 2019 prices).21 Though the residents of Australia enjoy high standards of living and Australia consistently ranks high on several development parameters, challenges arising from gender gaps and from population ageing continue to exist.
In June 2017, there were 193,900 more females than males residing in Australia, with 12.2 million males and 12.4 million females. The sex ratio (the number of males per hundred females) was 98.4.22 Women make up 46.9% of the workforce in Australia.23 However, they are over-represented as part-time workers in low-paid industries and under-represented in leadership roles in the private and public sectors. Accordingly, only 25.4% of all employed people in Australia are women working full-time. The workforce participation rate among those aged 15-64 years is 73.5% for women and 82.9% for men.23
Further, as per the Australian Government’s 2015 Intergenerational Report (IGR) projections, by 2054-55, the number of people in the age group 65 to 84 years will rise to 7.0 million compared to ~3.1 million in 2015. In order to sustain high levels of income and high standards of living, increased levels of productivity and participation of the population in the labour force is required. An ageing population will result in a significant amount of stress on health financing by increasing expenditure on age pensions and health care spending.
Immigration has been the largest contributor to the supply of working age population in Australia since the 1980s. Aged 15 years or over, migrants are typically younger than the resident population and therefore have significantly contributed to the workforce participation and productivity. While the screening process has been made stringent in the last few years, higher emphasis has been placed on skilled migrants since the 1990s. With continued participation from immigrants, the country may be able to resolve some issues arising from an ageing population.
16 Census reveals a fast changing, culturally diverse nation, 2017, ABS
17 Urban Population (% of total population), World Bank
18 ABS 3218.0
19 Melbourne, Sydney and Brisbane populations soar but growth drivers differ, 2018, ABC News
20 Top 10 countries of birth for the overseas-born population since 1901, Parliament of Australia
21 IMF
22 ABS 3235.0
23 Gender workplace statistics at a glance 2018-19, 2019, WGEA
Next topic: